绘制图形并导出geojson · Draw and export geojson · ▶ 在线运行案例
案例合集: 三维可视化功能案例(threehub.cn)
开源仓库github地址: https://github.com/z2586300277/three-cesium-examples
**400个案例代码: ** 网盘链接
你将学到什么
- Cesium Entity 高层实体 API
- GeoJSON 矢量面/线/点加载
效果说明
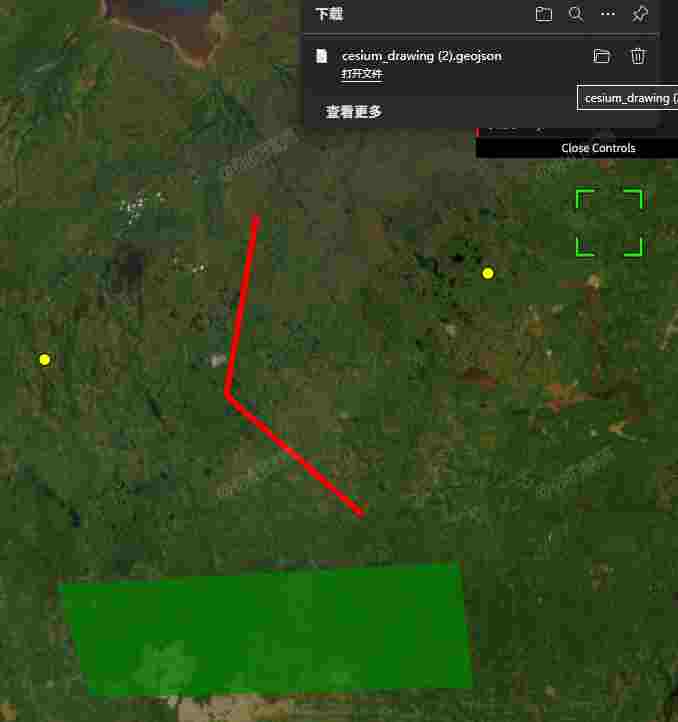
本案例演示 绘制图形并导出geojson 效果:Cesium绘图并导出GeoJSON工具,本工具提供交互式点、线、面绘制功能,并能导出为标准GeoJSON格式;核心用到 Cesium、GeoJSON。建议先打开文首在线案例查看动态画面,再对照下方源码逐步理解。
核心概念
- Viewer 聚合 Scene、Camera、Clock 与渲染循环,是 Cesium 应用入口。
- Entity 面向点线面/模型/标签的高层 API;与 Primitive 相比更适合交互与属性驱动。
- 阅读下方完整源码时,建议从
init/load/animate三条主线入手,再深入 shader 与工具函数。
实现步骤
- 创建 Viewer,配置地形/影像(若案例需要)并设置初始相机
- 在
requestAnimationFrame循环中更新状态并 render(Cesium 为viewer.render或自动渲染)
代码要点
/**
 * Cesium绘图并导出GeoJSON工具
 * 本工具提供交互式点、线、面绘制功能,并能导出为标准GeoJSON格式
 *
 * 功能说明:
 * 1. 用户点击"绘制点/线/面"按钮开始交互式绘制
 * 2. 在地图上点击选择点位置
 * 3. 点击"导出为Geojson"按钮将绘制内容导出为GeoJSON文件
 *
 * @module DrawAndExportGeojson
 * @author z2586300277
 * @version 1.0.0
 * @since 2024
 */

// ==================== 导入模块和初始化 ====================
/**
 * 导入Cesium库,用于3D地球可视化和地理空间数据处理
 * @external Cesium
 * @see {@link https://cesium.com/}
 */
import * as Cesium from 'cesium'

/**
 * 导入dat.GUI库,用于创建轻量级的图形用户界面控制面板
 * @external GUI
 * @see {@link https://github.com/dataarts/dat.gui}
 */
import { GUI } from 'dat.gui'

/**
 * 获取HTML中用于挂载Cesium Viewer的地图容器元素
 * @type {HTMLElement}
 * @constant
 */
const box = document.getElementById('box')

// ==================== GUI控制面板 ====================
/**
 * 定义图形绘制操作对象,包含所有GUI控制面板的功能按钮
 * @namespace obj
 * @property {Function} '绘制点' - 启动交互式点绘制模式
 * @property {Function} '绘制线' - 启动交互式线绘制模式
 * @property {Function} '绘制面' - 启动交互式面绘制模式
 * @property {Function} '全部清除' - 清除所有已绘制的实体
 * @property {Function} '导出为Geojson' - 将绘制内容导出为GeoJSON格式文件
 */
const obj = {
    /**
     * 绘制点功能 - 启动交互式点绘制模式
     * 当用户点击此按钮时,激活点绘制模式,允许用户在地图上点击添加点标记
     * @function
     * @memberof obj
     * @example
     * // 点击按钮后,用户可以在地图上点击添加点
     * // 每次点击都会创建一个新的点实体
     */
    '绘制点': () => {
        drawPoint()
    },
    /**
     * 绘制线功能 - 启动交互式线绘制模式
     * 当用户点击此按钮时,激活线绘制模式,允许用户通过连续点击创建线段
     * @function
     * @memberof obj
     * @example
     * // 点击按钮后,用户可以通过连续点击创建折线
     * // 右键结束绘制操作
     */
    '绘制线': () => {
        drawLine()
    },
    /**
     * 绘制面功能 - 启动交互式面绘制模式
     * 当用户点击此按钮时,激活面绘制模式,允许用户通过连续点击创建多边形
     * @function
     * @memberof obj
     * @example
     * // 点击按钮后,用户可以通过连续点击创建多边形
     * // 至少需要3个点才能形成面,右键结束绘制操作
     */
    '绘制面': () => {
        drawPlane()
    },
    /**
     * 全部清除功能 - 清除所有已绘制的实体
     * 移除地图上所有通过本工具创建的点、线、面等实体
     * @function
     * @memberof obj
     */
    '全部清除': () => {
        viewer.entities.removeAll();
    },
    /**
     * 导出为Geojson功能 - 将绘制内容导出为GeoJSON格式文件
     * 将当前地图上所有绘制的实体转换为GeoJSON格式并提供下载
     * @function
     * @memberof obj
     * @example
     * // 点击后会生成一个GeoJSON文件供用户下载
     * // 文件包含所有点、线、面的地理坐标信息
     */
    '导出为Geojson': () => {
        exportGeojson()
    }
};

/**
 * 创建图形用户界面控制面板实例
 * 使用dat.GUI库创建一个可折叠的控制面板,用于访问绘图工具的各种功能
 * @type {GUI}
 * @see {@link https://github.com/dataarts/dat.gui}
 */
const gui = new GUI();
for (const key in obj) gui.add(obj, key)

// ==================== Cesium Viewer初始化 ====================
/**
 * 初始化Cesium Viewer实例,这是整个应用的核心组件
 * Viewer是Cesium的主要_widget_,提供了完整的3D地球可视化功能
 * @type {Cesium.Viewer}
 * @constant
 * @see {@link https://cesium.com/learn/cesiumjs/ref-doc/Viewer.html}
 */
const viewer = new Cesium.Viewer(box, {
    animation: false,              // 不显示动画控件(时间轴左侧的播放按钮)
    baseLayerPicker: false,        // 不显示图层选择器(右上角的图层切换按钮)
    baseLayer: Cesium.ImageryLayer.fromProviderAsync(
        Cesium.ArcGisMapServerImageryProvider.fromUrl('https://server.arcgisonline.com/arcgis/rest/services/World_Imagery/MapServer')
    ),                             // 设置基础影像图层为ArcGIS世界影像图
    fullscreenButton: false,       // 不显示全屏按钮
    timeline: false,               // 不显示时间线控件
    infoBox: false,                // 不显示信息框(点击实体时的详细信息弹窗)
})

/**
 * 隐藏Cesium默认的Logo信息和版权信息
 * 通过修改CSS样式隐藏右下角的Cesium Ion logo和相关版权信息
 */
viewer._cesiumWidget._creditContainer.style.display = "none";

// ==================== 全局变量定义 ====================
/**
 * 绘图事件处理器实例,用于处理鼠标交互事件
 */
let drawHandler = null;

/**
 * 存储当前正在绘制的点坐标数组
 * 在绘制线或面时,存储用户已点击确认的点坐标
 * @type {Array<Cesium.Cartesian3>}
 */
let activePoints = [];

// ==================== 配置参数 ====================
const CONFIG = {
    /**
     * 点样式配置
     * @memberof CONFIG
     * @property {number} pixelSize - 点的像素大小
     * @property {Cesium.Color} color - 点的填充颜色
     * @property {Cesium.Color} outlineColor - 点的边框颜色
     * @property {number} outlineWidth - 点的边框宽度
     */
    point: {
        pixelSize: 10,
        color: Cesium.Color.YELLOW,
        outlineColor: Cesium.Color.BLACK,
        outlineWidth: 1,
    },
    /**
     * 线样式配置
     * @memberof CONFIG
     * @property {number} width - 线的宽度(像素)
     * @property {Cesium.Color} material - 线的材质颜色
     */
    line: {
        width: 5,
        material: Cesium.Color.RED.withAlpha(1),
    },
    /**
     * 面样式配置
     * @memberof CONFIG
     * @property {Cesium.Color} material - 面的填充材质
     * @property {boolean} outline - 是否显示边框
     * @property {Cesium.Color} outlineColor - 边框颜色
     * @property {number} outlineWidth - 边框宽度
     */
    polygon: {
        material: Cesium.Color.GREEN.withAlpha(0.7),
        outline: true,
        outlineColor: Cesium.Color.GREEN,
        outlineWidth: 2
    },
    /**
     * 临时线样式配置(用于绘制过程中的预览线)
     * @memberof CONFIG
     * @property {number} width - 线的宽度(像素)
     * @property {Cesium.Color} material - 线的材质颜色(带透明度)
     */
    tempLine: {
        width: 3,
        material: Cesium.Color.RED.withAlpha(0.5),
    }
};

// ==================== 图形创建函数 ====================
/**
 * 创建点标记实体
 * 在指定的地理坐标位置创建一个点标记
 */
function createPointMarker(position) {
    return viewer.entities.add({
        position: position,
        point: {
            pixelSize: CONFIG.point.pixelSize,
            color: CONFIG.point.color,
            outlineColor: CONFIG.point.outlineColor,
            outlineWidth: CONFIG.point.outlineWidth
        }
    });
}

/**
 * 创建线段实体
 * 根据给定的点坐标数组创建线段实体
 */
function createLine(positions, isTemp = false) {
    return viewer.entities.add({
        polyline: {
            positions: positions,
            width: isTemp ? CONFIG.tempLine.width : CONFIG.line.width,
            material: isTemp ? CONFIG.tempLine.material : CONFIG.line.material
        }
    });
}

/**
 * 创建多边形实体
 * 根据给定的点坐标数组创建多边形实体
 */
function createPolygon(positions) {
    return viewer.entities.add({
        polygon: {
            hierarchy: new Cesium.PolygonHierarchy(positions),
            material: CONFIG.polygon.material,
            outline: CONFIG.polygon.outline,
            outlineColor: CONFIG.polygon.outlineColor,
            outlineWidth: CONFIG.polygon.outlineWidth
        }
    });
}

// ==================== 绘图控制函数 ====================
/**
 * 清除当前绘制状态
 * 销毁当前的绘图事件处理器并重置活动点数组
 * 在开始新的绘制操作前调用此函数以确保状态干净
 */
function clearDrawing() {
    // 如果存在之前的绘图处理器,销毁它以释放资源
    if (drawHandler) {
        drawHandler.destroy();
        drawHandler = null;
    }
    // 清空活动点数组
    activePoints = [];
}

/**
 * 初始化绘图处理器
 * 创建并配置用于处理鼠标交互事件的处理器
 * @param {Function} clickHandler - 鼠标左键点击事件处理函数
 * @param {Function} moveHandler - 鼠标移动事件处理函数
 * @param {Function} endHandler - 结束绘制事件处理函数(通常是右键点击)
 * @example
 * // 初始化一个只处理点击事件的处理器
 * initDrawingHandler(clickFunction, null, null);
 *
 * // 初始化处理点击、移动和结束事件的完整处理器
 * initDrawingHandler(clickFunction, moveFunction, endFunction);
 */
function initDrawingHandler(clickHandler, moveHandler, endHandler) {
    // 清除之前的绘制内容,确保状态干净
    clearDrawing();

    // 创建事件处理器实例,绑定到Viewer的canvas元素
    drawHandler = new Cesium.ScreenSpaceEventHandler(viewer.canvas);

    // 注册鼠标左键点击事件处理函数(用于添加点)
    if (clickHandler) {
        drawHandler.setInputAction(clickHandler, Cesium.ScreenSpaceEventType.LEFT_CLICK);
    }

    // 注册鼠标移动事件处理函数(用于实时预览)
    if (moveHandler) {
        drawHandler.setInputAction(moveHandler, Cesium.ScreenSpaceEventType.MOUSE_MOVE);
    }

    // 注册鼠标右键点击事件处理函数(用于结束绘制)
    if (endHandler) {
        drawHandler.setInputAction(endHandler, Cesium.ScreenSpaceEventType.RIGHT_CLICK);
    }
}

/**
 * 绘制点功能实现
 * 激活点绘制模式,用户每次左键点击都会在地图上创建一个点标记
 * 此模式不需要结束操作,可以连续点击创建多个点
 */
function drawPoint() {
    /**
     * 初始化点绘制处理器
     * 只需要处理点击事件,不需要处理移动和结束事件
     */
    initDrawingHandler(
        // 点击处理函数
        function (movement) {
            // 将屏幕坐标转换为笛卡尔坐标
            const cartesian = viewer.scene.pickPosition(movement.position);
            if (cartesian) {
                // 创建点实体
                createPointMarker(cartesian);
            }
        },
        null, // 无需鼠标移动处理
        null  // 无需结束处理
    );
}

/**
 * 绘制线功能实现
 * 激活线绘制模式,用户通过连续左键点击创建折线,右键结束绘制
 * 绘制过程中会显示临时线段预览
 */
function drawLine() {
    /**
     * 临时线段实体,用于在绘制过程中显示预览效果
     * @type {Cesium.Entity|null}
     */
    let tempLineEntity = null;

    /**
     * 初始化线绘制处理器
     * 需要处理点击、移动和结束事件
     */
    initDrawingHandler(
        // 点击处理函数 - 添加新的点到线中
        function (movement) {
            // 将屏幕坐标转换为笛卡尔坐标
            const cartesian = viewer.scene.pickPosition(movement.position);
            if (cartesian) {
                // 将新点添加到活动点数组
                activePoints.push(cartesian);

                // 如果至少有两个点,创建线段连接最后两个点
                if (activePoints.length >= 2) {
                    createLine([
                        activePoints[activePoints.length - 2],
                        activePoints[activePoints.length - 1]
                    ]);
                }
            }
        },
        // 鼠标移动处理函数 - 实时更新临时线段预览
        function (movement) {
            // 获取鼠标当前位置的笛卡尔坐标
            const cartesian = viewer.scene.pickPosition(movement.endPosition);
            // 如果已有至少一个点且能获取到当前位置
            if (cartesian && activePoints.length > 0) {
                if (tempLineEntity) {
                    // 更新临时线段的端点
                    tempLineEntity.polyline.positions = [activePoints[activePoints.length - 1], cartesian];
                } else {
                    // 创建新的临时线段
                    tempLineEntity = createLine([activePoints[activePoints.length - 1], cartesian], true);
                }
            }
        },
        // 右键结束处理函数 - 完成线绘制操作
        function () {
            // 清除临时实体
            if (tempLineEntity) {
                viewer.entities.remove(tempLineEntity);
                tempLineEntity = null;
            }

            // 销毁事件处理器
            if (drawHandler) {
                drawHandler.destroy();
                drawHandler = null;
            }
            // 重置活动点数组
            activePoints = [];
        }
    );
}

/**
 * 绘制面功能实现
 * 激活面绘制模式,用户通过连续左键点击创建多边形,右键结束绘制
 * 绘制过程中会显示临时面预览
 */
function drawPlane() {
    /**
     * 临时面实体,用于在绘制过程中显示预览效果
     * @type {Cesium.Entity|null}
     */
    let tempPlaneEntity = null;

    /**
     * 临时点标记数组,存储绘制过程中创建的点标记
     * @type {Array<Cesium.Entity>}
     */
    let tempPoints = [];

    /**
     * 初始化面绘制处理器
     * 需要处理点击、移动和结束事件
     */
    initDrawingHandler(
        // 点击处理函数 - 添加新的顶点到面中
        function (movement) {
            // 将屏幕坐标转换为笛卡尔坐标
            const cartesian = viewer.scene.pickPosition(movement.position);
            if (cartesian) {
                // 添加点到活动点数组
                activePoints.push(cartesian);

                // 创建点标记以可视化顶点位置
                tempPoints.push(createPointMarker(cartesian));

                // 如果已经有面实体,则更新它
                if (tempPlaneEntity) {
                    // 更新面的顶点
                    tempPlaneEntity.polygon.hierarchy = new Cesium.PolygonHierarchy(activePoints);
                } else if (activePoints.length >= 3) {
                    // 创建新的面实体(至少需要3个点)
                    tempPlaneEntity = createPolygon(activePoints);
                }
            }
        },
        // 鼠标移动处理函数 - 实时更新临时面预览
        function (movement) {
            // 获取鼠标当前位置的笛卡尔坐标
            const cartesian = viewer.scene.pickPosition(movement.endPosition);
            // 如果已有至少两个点且能获取到当前位置
            if (cartesian && activePoints.length >= 2) {
                // 创建临时点数组,包含所有已确认的点和当前鼠标位置
                const tempPositions = [...activePoints, cartesian];

                if (tempPlaneEntity) {
                    // 更新面的顶点
                    tempPlaneEntity.polygon.hierarchy = new Cesium.PolygonHierarchy(tempPositions);
                } else if (tempPositions.length >= 3) {
                    // 创建新的面实体(至少需要3个点)
                    tempPlaneEntity = createPolygon(tempPositions);
                }
            }
        },
        // 右键结束处理函数 - 完成面绘制操作
        function () {
            // 如果点数少于3个,移除临时实体(无法构成面)
            if (activePoints.length < 3 && tempPlaneEntity) {
                viewer.entities.remove(tempPlaneEntity);
                tempPlaneEntity = null;
            }

            // 更新面实体的最终顶点
            if (tempPlaneEntity) {
                tempPlaneEntity.polygon.hierarchy = new Cesium.PolygonHierarchy(activePoints);
            }

            // 移除所有临时点标记
            tempPoints.forEach(element => {
                viewer.entities.remove(element)
            });

            // 销毁事件处理器
            if (drawHandler) {
                drawHandler.destroy();
                drawHandler = null;
            }

            // 重置临时数组
            tempPoints = [];
            activePoints = [];
        }
    );
}

// ==================== GeoJSON导出功能 ====================
/**
 * 导出为GeoJSON格式文件
 * 将当前地图上所有绘制的实体转换为GeoJSON格式并提供下载
 * 支持点、线、面三种几何类型的导出
 */
function exportGeojson() {
    // 创建GeoJSON对象结构
    const geojson = {
        type: "FeatureCollection",  // GeoJSON类型:要素集合
        features: []                // 要素数组,将包含所有转换后的实体
    };

    // 遍历所有绘制的实体并转换为GeoJSON要素
    viewer.entities.values.forEach(entity => {
        const feature = convertEntityToGeoJsonFeature(entity);
        if (feature) {
            geojson.features.push(feature);
        }
    });

    // 如果有可导出的要素,则创建下载文件
    if (geojson.features.length > 0) {
        // 将GeoJSON对象转换为格式化的JSON字符串
        const dataStr = "data:text/json;charset=utf-8," + encodeURIComponent(JSON.stringify(geojson, null, 2));

        // 创建临时下载链接元素
        const downloadAnchorNode = document.createElement('a');
        downloadAnchorNode.setAttribute("href", dataStr);
        downloadAnchorNode.setAttribute("download", "cesium_drawing.geojson"); // 设置下载文件名
        document.body.appendChild(downloadAnchorNode); // 添加到DOM中

        // 触发点击事件开始下载
        downloadAnchorNode.click();
        downloadAnchorNode.remove(); // 下载完成后移除临时元素
    } else {
        // 如果没有可导出的实体,提示用户
        alert('没有可导出的实体')
    }
}

/**
 * 将Cesium实体转换为GeoJSON要素
 * 根据实体类型(点、线、面)提取相应的地理坐标信息并构造成GeoJSON格式
 * @param {Cesium.Entity} entity - 需要转换的Cesium实体
 * @returns {Object|null} GeoJSON要素对象,如果无法转换则返回null
 * @example
 * const entity = viewer.entities.getById('point1');
 * const feature = convertEntityToGeoJsonFeature(entity);
 * // 返回类似:
 * // {
 * //   type: "Feature",
 * //   properties: { id: "point1", name: "" },
 * //   geometry: {
 * //     type: "Point",
 * //     coordinates: [-122.0, 37.5]
 * //   }
 * // }
 */
function convertEntityToGeoJsonFeature(entity) {
    // 创建GeoJSON要素的基本结构
    const feature = {
        type: "Feature",
        properties: {
            id: entity.id,           // 实体ID
            name: entity.name || ""  // 实体名称(如果没有则为空字符串)
        },
        geometry: null  // 几何信息占位符
    };

    // 处理点实体
    if (entity.position && entity.point) {
        // 获取实体当前位置(考虑时间动态性)
        const position = entity.position.getValue(Cesium.JulianDate.now());
        // 将笛卡尔坐标转换为大地坐标(弧度制)
        const cartographic = Cesium.Cartographic.fromCartesian(position);
        if (cartographic) {
            // 构造点几何信息(转换为度数)
            feature.geometry = {
                type: "Point",
                coordinates: [
                    Cesium.Math.toDegrees(cartographic.longitude),  // 经度
                    Cesium.Math.toDegrees(cartographic.latitude)    // 纬度
                ]
            };
            return feature;  // 返回构造好的点要素
        }
    }

    // 处理线实体
    if (entity.polyline) {
        // 获取线的所有顶点坐标
        const positions = entity.polyline.positions.getValue(Cesium.JulianDate.now());
        // 确保有有效的坐标数据
        if (positions && positions.length > 0) {
            // 将所有笛卡尔坐标转换为经纬度坐标
            const coordinates = positions.map(position => {
                const cartographic = Cesium.Cartographic.fromCartesian(position);
                return [
                    Cesium.Math.toDegrees(cartographic.longitude),  // 经度
                    Cesium.Math.toDegrees(cartographic.latitude)    // 纬度
                ];
            });

            // 构造线几何信息
            feature.geometry = {
                type: "LineString",
                coordinates: coordinates
            };
            return feature;  // 返回构造好的线要素
        }
    }

    // 处理面实体
    if (entity.polygon) {
        // 获取面的层级结构(包含顶点信息)
        const hierarchy = entity.polygon.hierarchy.getValue(Cesium.JulianDate.now());
        // 确保有有效的顶点数据
        if (hierarchy && hierarchy.positions && hierarchy.positions.length > 0) {
            // 构造面的坐标数组(GeoJSON面需要嵌套数组)
            const coordinates = [[]];

            // 转换所有顶点坐标
            hierarchy.positions.forEach(position => {
                const cartographic = Cesium.Cartographic.fromCartesian(position);
                coordinates[0].push([
                    Cesium.Math.toDegrees(cartographic.longitude),  // 经度
                    Cesium.Math.toDegrees(cartographic.latitude)    // 纬度
                ]);
            });

            // 闭合多边形(将第一个点添加到末尾以闭合面)
            if (hierarchy.positions.length > 0) {
                const firstPos = hierarchy.positions[0];
                const cartographic = Cesium.Cartographic.fromCartesian(firstPos);
                coordinates[0].push([
                    Cesium.Math.toDegrees(cartographic.longitude),  // 经度
                    Cesium.Math.toDegrees(cartographic.latitude)    // 纬度
                ]);
            }

            // 构造面几何信息
            feature.geometry = {
                type: "Polygon",
                coordinates: coordinates
            };
            return feature;  // 返回构造好的面要素
        }
    }

    // 如果实体不是点、线或面,则返回null
    return null;
}
完整源码:GitHub
小结
- 本文提供 绘制图形并导出geojson 完整 Cesium.js 源码与在线 Demo,建议先运行案例再改 uniform/参数做二次实验
- 更多 Cesium.js 实战案例见 three-cesium-examples 合集 与 GitHub 开源仓库