Canvas贴图 · Canvas Texture · ▶ 在线运行案例
案例合集: 三维可视化功能案例(threehub.cn)
开源仓库github地址: https://github.com/z2586300277/three-cesium-examples
**400个案例代码: ** 网盘链接
你将学到什么
- onBeforeCompile 注入 GLSL 改造内置材质
- OrbitControls 相机轨道交互
- Canvas 动态纹理贴图
- ECharts 与 WebGL 场景联动
requestAnimationFrame渲染循环与resize自适应
效果说明
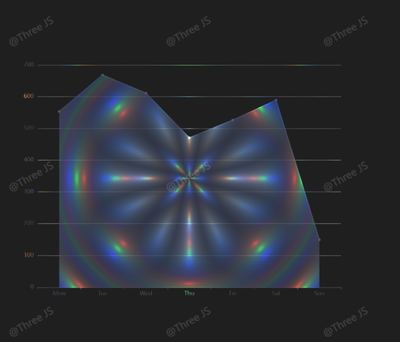
本案例演示 Canvas贴图 效果:用 Canvas 2D 绘制内容并实时映射为 Three.js 纹理,ECharts 图表与 Three.js 场景同屏联动展示;核心用到 onBeforeCompile、OrbitControls、Canvas。建议先打开文首在线案例查看动态画面,再对照下方源码逐步理解。
核心概念
- Scene / Camera / WebGLRenderer 构成最小渲染闭环;大场景可开
logarithmicDepthBuffer缓解 Z-fighting。 - onBeforeCompile 在 Three 拼好内置 shader 后替换
#include <xxx>片段,适合在 PBR 材质上叠加大屏特效。 - OrbitControls 提供轨道旋转/缩放;开启
enableDamping后需在 animate 中controls.update()。 - CanvasTexture 每帧或按需把 2D Canvas 内容上传 GPU,适合动态文字、图表、视频帧贴图。
实现步骤
- 搭建 Scene、PerspectiveCamera、WebGLRenderer,挂载 canvas 并处理
resize - 定义 uniforms / onBeforeCompile 或 ShaderMaterial,编写 GLSL 与材质参数
- 创建 OrbitControls(及 Raycaster 等交互控件,若源码包含)
- 在定时器或 GSAP 时间轴中更新 uniform / 变换,驱动特效播放
- 在
requestAnimationFrame循环中更新状态并 render(Cesium 为viewer.render或自动渲染)
代码要点
import * as THREE from 'three'
import { OrbitControls } from 'three/examples/jsm/controls/OrbitControls.js'
import * as echarts from 'echarts'

const box = document.getElementById('box')

const scene = new THREE.Scene()

const camera = new THREE.PerspectiveCamera(75, box.clientWidth / box.clientHeight, 0.1, 100000)

camera.position.set(0, 0, 3)

const renderer = new THREE.WebGLRenderer({ antialias: true, alpha: true, logarithmicDepthBuffer: true })

renderer.setSize(box.clientWidth, box.clientHeight)

box.appendChild(renderer.domElement)

new OrbitControls(camera, renderer.domElement)

const w = 800, h = 600
const container = document.createElement('canvas')
// 设置实际尺寸而不是CSS尺寸
container.width = w
container.height = h
// 保持CSS尺寸以便echarts正确初始化
container.style.width = w + "px"
container.style.height = h + "px"

const myChart = echarts.init(container, null, {
    devicePixelRatio: window.devicePixelRatio // 使用正确的设备像素比
})
const texture = new THREE.CanvasTexture(container)
// 设置贴图过滤模式以提高清晰度
texture.minFilter = THREE.LinearFilter
texture.magFilter = THREE.LinearFilter

// 计算保持纵横比的平面尺寸
const aspectRatio = w / h
const planeWidth = 4
const planeHeight = planeWidth / aspectRatio
const planeGeometry = new THREE.PlaneGeometry(planeWidth, planeHeight)
const planeMaterial = new THREE.MeshBasicMaterial({ map: texture, side: THREE.DoubleSide, transparent: true })
const plane = new THREE.Mesh(planeGeometry, planeMaterial)
scene.add(plane)

const uniforms = {
    iResolution: {
        type: 'v2',
        value: new THREE.Vector2(box.clientWidth, box.clientHeight)
    },
    iTime: {
        type: 'f',
        value: 1.0
    }
}
planeMaterial.onBeforeCompile = shader => {
    shader.uniforms.iResolution = uniforms.iResolution
    shader.uniforms.iTime = uniforms.iTime
    shader.fragmentShader = shader.fragmentShader.replace(/#include <common>/, `
        uniform vec2 iResolution;
        uniform float iTime;
        #include <common>
    `)
    shader.fragmentShader = shader.fragmentShader.replace('vec4 diffuseColor = vec4( diffuse, opacity );', `
        vec3 c;
        float l,z=iTime;
        for(int i=0;i<3;i++) {
            vec2 uv,p=gl_FragCoord.xy/iResolution;
            uv=p +  2.0;
            p-=.5;
            p.x*=iResolution.x/iResolution.y;
            z+=.07;
            l=length(p);
            uv+=p/l*(sin(z)+1.)*abs(sin(l*9.-z-z));
            c[i]=.01/length(mod(uv,1.)-.5);
        }
        vec4 diffuseColor = vec4( diffuse * c  * vec3(8.,8.,8.), opacity );
    `)
}

animate()

function animate() {
    texture.needsUpdate = true
    uniforms.iTime.value += 0.05
    requestAnimationFrame(animate)
    renderer.render(scene, camera)

}

const data = [820, 932, 901, 934, 1290, 1330, 1320]
const option = {
    xAxis: {
        type: 'category',
        data: ['Mon', 'Tue', 'Wed', 'Thu', 'Fri', 'Sat', 'Sun']
    },
    yAxis: {
        type: 'value'
    },
    series: [
        {
            data,
            type: 'line',
            areaStyle: {}
        }
    ]
}
myChart.setOption(option)
setInterval(() => {
    data.forEach((item, index) => {
        data[index] = Math.floor(Math.random() * 1000)
    })
    myChart.setOption({
        series: [{
            data: data
        }]
    })
}, 2000)
完整源码:GitHub
小结
- 本文提供 Canvas贴图 完整 Three.js 源码与在线 Demo,建议先运行案例再改 uniform/参数做二次实验
- 更多 Three.js 实战案例见 three-cesium-examples 合集 与 GitHub 开源仓库