柱状图 · Bar Charts · ▶ 在线运行案例
案例合集: 三维可视化功能案例(threehub.cn)
开源仓库github地址: https://github.com/z2586300277/three-cesium-examples
**400个案例代码: ** 网盘链接
你将学到什么
- OrbitControls 相机轨道交互
- ECharts 与 WebGL 场景联动
- BufferGeometry 自定义顶点/索引数据
- CSS2D/3D 标签 DOM 叠加
requestAnimationFrame渲染循环与resize自适应
效果说明
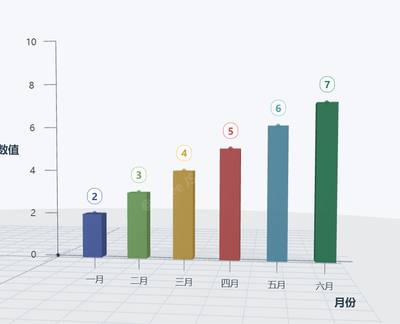
本案例演示 柱状图 效果:ECharts 图表与 Three.js 场景同屏联动展示;核心用到 OrbitControls、ECharts、BufferGeometry。建议先打开文首在线案例查看动态画面,再对照下方源码逐步理解。
核心概念
- Scene / Camera / WebGLRenderer 构成最小渲染闭环;大场景可开
logarithmicDepthBuffer缓解 Z-fighting。 - OrbitControls 提供轨道旋转/缩放;开启
enableDamping后需在 animate 中controls.update()。 - 阅读下方完整源码时,建议从
init/load/animate三条主线入手,再深入 shader 与工具函数。
实现步骤
- 搭建灯光与环境(如有)
- requestAnimationFrame 循环 update + render
代码要点
<!DOCTYPE html>
<html lang="zh-CN">

<head>
    <meta charset="UTF-8">
    <title>Three.js 柱状图 · ECharts 标准风格</title>
    <style>
        body {
            margin: 0;
            overflow: hidden;
            font-family: "Microsoft YaHei", sans-serif;
        }

        canvas {
            display: block;
        }

        /* 坐标轴标签:清爽灰色,无干扰 */
        .axis-tick-label {
            color: #4a4a4a;
            font-size: 13px;
            font-weight: normal;
            white-space: nowrap;
            pointer-events: none;
            text-shadow: 0 0 2px rgba(255, 255, 255, 0.8);
        }

        /* 轴名称标签 (ECharts 风格:加粗,深色) */
        .axis-name-label {
            color: #2c3e50;
            font-size: 16px;
            font-weight: 600;
            white-space: nowrap;
            pointer-events: none;
            text-shadow: 0 0 3px rgba(255, 255, 255, 0.9);
        }

        /* 柱顶数值标签:醒目红褐色,类似ECharts 强调 */
        .bar-value-label {
            color: #c0392b;
            font-size: 14px;
            font-weight: 600;
            white-space: nowrap;
            pointer-events: none;
            text-shadow: 0 0 5px rgba(255, 255, 255, 0.8);
            background: rgba(255, 255, 255, 0.6);
            padding: 2px 6px;
            border-radius: 10px;
            border: 1px solid rgba(192, 57, 43, 0.3);
            backdrop-filter: blur(2px);
        }

        /* 简单辅助:去掉滚动条,干净视图 */
    </style>
</head>

<body>
    <script type="importmap">
        {
          "imports": {
            "three": "https://threejs.org/build/three.module.js",
            "three/addons/": "https://threejs.org/examples/jsm/"
          }
        }
      </script>
    <script type="module">
        import * as THREE from 'three';
        import { OrbitControls } from 'three/addons/controls/OrbitControls.js';
        import { CSS2DRenderer, CSS2DObject } from 'three/addons/renderers/CSS2DRenderer.js';
        // ---------- 1. 初始化场景、相机、渲染器(增强抗锯齿与性能)----------
        const scene = new THREE.Scene();
        scene.background = new THREE.Color(0xf5f7fa); // 柔和灰白背景,类似ECharts容器
        const camera = new THREE.PerspectiveCamera(
            45, // 更小视角,减少畸变,更接近2D感
            window.innerWidth / window.innerHeight,
            0.1,
            1000
        );
        camera.position.set(9, 7, 14);
        camera.lookAt(4, 3, 0);
        const renderer = new THREE.WebGLRenderer({ antialias: true });
        renderer.setSize(window.innerWidth, window.innerHeight);
        renderer.shadowMap.enabled = true;        // 开启阴影,更真实
        renderer.shadowMap.type = THREE.PCFSoftShadowMap;
        renderer.setPixelRatio(window.devicePixelRatio);
        document.body.appendChild(renderer.domElement);
        // 轨道控制器,带阻尼
        const controls = new OrbitControls(camera, renderer.domElement);
        controls.enableDamping = true;
        controls.dampingFactor = 0.06;
        controls.autoRotate = false;
        controls.enableZoom = true;
        controls.target.set(4, 3, 0);
        controls.minDistance = 8;
        controls.maxDistance = 30;
        // ---------- 2. CSS2渲染器(用于所有文字标签:轴刻度、轴名称、柱顶数值)----------
        const labelRenderer = new CSS2DRenderer();
        labelRenderer.setSize(window.innerWidth, window.innerHeight);
        labelRenderer.domElement.style.position = 'absolute';
        labelRenderer.domElement.style.top = '0px';
        labelRenderer.domElement.style.left = '0px';
        labelRenderer.domElement.style.pointerEvents = 'none'; // 不阻挡点击
        document.body.appendChild(labelRenderer.domElement);
        // ---------- 3. 灯光系统(呈现立体感,但不刺眼)----------
        // 环境光提供基础照明
        const ambientLight = new THREE.AmbientLight(0xffffff, 0.6);
        scene.add(ambientLight);
        // 主光源 - 产生阴影
        const mainLight = new THREE.DirectionalLight(0xfff5e6, 1.0);
        mainLight.position.set(8, 12, 8);
        mainLight.castShadow = true;
        mainLight.receiveShadow = true;
        mainLight.shadow.mapSize.width = 1024;
        mainLight.shadow.mapSize.height = 1024;
        mainLight.shadow.camera.near = 0.5;
        mainLight.shadow.camera.far = 30;
        mainLight.shadow.camera.left = -15;
        mainLight.shadow.camera.right = 15;
        mainLight.shadow.camera.top = 15;
        mainLight.shadow.camera.bottom = -15;
        scene.add(mainLight);
        // 辅助背光,增加柱子暗部细节
        const backLight = new THREE.DirectionalLight(0xe0f0ff, 0.5);
        backLight.position.set(-5, 0, 10);
        scene.add(backLight);
        // 补充侧光
        const fillLight = new THREE.PointLight(0xccddff, 0.3);
        fillLight.position.set(2, 5, 12);
        scene.add(fillLight);
        // ---------- 4. 图表数据(ECharts 标准:一月到六月,数值清晰)----------
        const chartData = [
            { label: '一月', value: 2 },
            { label: '二月', value: 3 },
            { label: '三月', value: 4 },
            { label: '四月', value: 5 },
            { label: '五月', value: 6 },
            { label: '六月', value: 7 }
        ];
        // 配置参数 —— 完全符合柱状图审美
        const config = {
            columnWidth: 0.9,          // 柱子宽一些,更饱满
            columnDepth: 0.9,          // Z轴厚度
            yMax: 10,                 // Y轴最大值固定为10,留白更ECharts(原数据最大7,顶部留空间显示数值)
            xStep: 2.1,              // 柱间距适中
            yStep: 2,                // Y轴刻度步长
            axisColor: 0x5d6d7e,     // 轴体深蓝灰,专业感
            axisLineWidth: 2.2,      // 轴线条加粗
            columnColors: [0x5470c6, 0x91cc75, 0xfac858, 0xee6666, 0x73c0de, 0x3ba272], // ECharts 经典配色
            columnXOffset: 1.8,      // 柱子起点与Y轴留白,避免拥挤(ECharts风格)
            groundOpacity: 0.15,      // 地面极浅,仅作视觉参考
            shadowOpacity: 0.3
        };
        // ---------- 5. 地面(接收阴影,视觉锚点)----------
        const groundGeometry = new THREE.CircleGeometry(30, 32); // 圆形地面更柔和
        const groundMaterial = new THREE.MeshStandardMaterial({
            color: 0xe9ecef,
            roughness: 0.8,
            metalness: 0.1,
            transparent: true,
            opacity: config.groundOpacity,
            side: THREE.DoubleSide
        });
        const ground = new THREE.Mesh(groundGeometry, groundMaterial);
        ground.rotation.x = -Math.PI / 2;
        ground.position.y = -0.1;
        ground.receiveShadow = true;
        scene.add(ground);
        // 添加一个极细的网格辅助线(可选,增强坐标感,但不抢眼)
        const gridHelper = new THREE.GridHelper(26, 20, 0x9aa6b2, 0xcbd5e0);
        gridHelper.position.y = -0.09;
        scene.add(gridHelper);
        // ---------- 6. 坐标轴系统(完全参照ECharts:轴线明显,刻度清晰,轴标签明确)----------
        const axisMaterial = new THREE.LineBasicMaterial({
            color: config.axisColor,
            linewidth: config.axisLineWidth
        });
        // ===== X轴 =====
        const xAxisStart = -0.5;
        const xAxisEnd = (chartData.length - 1) * config.xStep + config.columnXOffset + 1.2;
        const xAxisPoints = [new THREE.Vector3(xAxisStart, 0, 0), new THREE.Vector3(xAxisEnd, 0, 0)];
        const xAxisGeo = new THREE.BufferGeometry().setFromPoints(xAxisPoints);
        const xAxisLine = new THREE.Line(xAxisGeo, axisMaterial);
        scene.add(xAxisLine);
        // X轴刻度与分类标签
        chartData.forEach((item, i) => {
            const xPos = i * config.xStep + config.columnXOffset;
            // 刻度线(向下,长度0.6,清晰可见)
            const tickPoints = [
                new THREE.Vector3(xPos, 0, 0),
                new THREE.Vector3(xPos, -0.6, 0)
            ];
            const tickGeo = new THREE.BufferGeometry().setFromPoints(tickPoints);
            const tick = new THREE.Line(tickGeo, axisMaterial);
            scene.add(tick);
            // 分类标签 (CSS2D) —— ECharts风格:居中,字体适中
            const labelDiv = document.createElement('div');
            labelDiv.className = 'axis-tick-label';
            labelDiv.textContent = item.label;
            labelDiv.style.transform = 'translate(-50%, 0)';
            labelDiv.style.fontWeight = '500';
            labelDiv.style.color = '#2e4053';
            const labelObj = new CSS2DObject(labelDiv);
            labelObj.position.set(xPos, -1.1, 0);
            scene.add(labelObj);
        });
        // X轴名称 “月份” (ECharts标准:置于轴末端附近,加粗)
        const xNameDiv = document.createElement('div');
        xNameDiv.className = 'axis-name-label';
        xNameDiv.textContent = '月份';
        xNameDiv.style.transform = 'translate(-50%, 0)';
        const xNameLabel = new CSS2DObject(xNameDiv);
        xNameLabel.position.set(xAxisEnd - 0.3, -1.8, 0);
        scene.add(xNameLabel);
        // ===== Y轴 =====
        const yAxisStart = 0;
        const yAxisEnd = config.yMax;
        const yAxisPoints = [new THREE.Vector3(0, yAxisStart, 0), new THREE.Vector3(0, yAxisEnd, 0)];
        const yAxisGeo = new THREE.BufferGeometry().setFromPoints(yAxisPoints);
        const yAxisLine = new THREE.Line(yAxisGeo, axisMaterial);
        scene.add(yAxisLine);
        // Y轴刻度和数值标签(0到10,步长2,完全展示)
        for (let val = 0; val <= config.yMax; val += config.yStep) {
            // 刻度线(向左,长度0.6)
            const tickPoints = [
                new THREE.Vector3(0, val, 0),
                new THREE.Vector3(-0.6, val, 0)
            ];
            const tickGeo = new THREE.BufferGeometry().setFromPoints(tickPoints);
            const tick = new THREE.Line(tickGeo, axisMaterial);
            scene.add(tick);
            // 数值标签
            const labelDiv = document.createElement('div');
            labelDiv.className = 'axis-tick-label';
            labelDiv.textContent = val;
            labelDiv.style.transform = 'translate(0, -50%)';
            labelDiv.style.fontWeight = '500';
            const labelObj = new CSS2DObject(labelDiv);
            labelObj.position.set(-1.2, val, 0);
            scene.add(labelObj);
        }
        // Y轴名称 “数值” (ECharts风格:垂直居中,加粗)
        const yNameDiv = document.createElement('div');
        yNameDiv.className = 'axis-name-label';
        yNameDiv.textContent = '数值';
        yNameDiv.style.transform = 'translate(0, -50%)';
        const yNameLabel = new CSS2DObject(yNameDiv);
        yNameLabel.position.set(-2.4, config.yMax / 2, 0);
        scene.add(yNameLabel);
        // ===== 原点装饰(加强视觉)=====
        const originDotGeo = new THREE.SphereGeometry(0.08);
        const originDotMat = new THREE.MeshStandardMaterial({ color: 0x2c3e50, emissive: 0x1a2630, emissiveIntensity: 0.2 });
        const originDot = new THREE.Mesh(originDotGeo, originDotMat);
        originDot.position.set(0, 0, 0);
        scene.add(originDot);
        // ---------- 7. 柱状图主体(每个柱子带阴影、柱顶数值标签,严格按ECharts标准)----------
        chartData.forEach((item, i) => {
            const xPos = i * config.xStep + config.columnXOffset;
            const height = item.value;     // 实际数值
            const color = config.columnColors[i % config.columnColors.length];
            // 柱子材质:轻微光泽,略带透明感但清晰
            const columnMaterial = new THREE.MeshStandardMaterial({
                color: color,
                roughness: 0.45,
                metalness: 0.2,
                emissive: new THREE.Color(color).multiplyScalar(0.1),
                emissiveIntensity: 0.2,
                transparent: true,
                opacity: 0.95
            });
            const columnGeo = new THREE.BoxGeometry(
                config.columnWidth,
                height,
                config.columnDepth
            );
            const column = new THREE.Mesh(columnGeo, columnMaterial);
            column.castShadow = true;
            column.receiveShadow = true;
            column.position.set(xPos, height / 2, 0);
            scene.add(column);
            // ----- 柱顶数值标签(核心要求:每一个柱子顶部显示相应的值,ECharts 风格)-----
            const valueDiv = document.createElement('div');
            valueDiv.className = 'bar-value-label';
            valueDiv.textContent = item.value;   // 简洁显示数值
            // 仿ECharts: 白色底框+红褐色字,小圆角
            valueDiv.style.background = 'rgba(255, 255, 255, 0.8)';
            valueDiv.style.border = '1px solid ' + new THREE.Color(color).getStyle();
            valueDiv.style.color = new THREE.Color(color).multiplyScalar(0.6).getStyle();
            const valueLabel = new CSS2DObject(valueDiv);
            // 标签置于柱子顶部上方0.8处,醒目不重叠
            valueLabel.position.set(xPos, height + 0.8, 0);
            scene.add(valueLabel);
            // ----- 额外加一个微小的柱顶圆点,提升细节 (ECharts有时会有标记) -----
            const topDotGeo = new THREE.SphereGeometry(0.1);
            const topDotMat = new THREE.MeshStandardMaterial({ color: color, emissive: color, emissiveIntensity: 0.2 });
            const topDot = new THREE.Mesh(topDotGeo, topDotMat);
            topDot.position.set(xPos, height, 0);
            topDot.castShadow = false;
            scene.add(topDot);
        });
        // ---------- 8. 添加一个轻量的Z轴短线示意(虽然2D柱状图,但3D空间给出方位)----------
        const zAxisPoints = [new THREE.Vector3(0, 0, -2), new THREE.Vector3(0, 0, 2)];
        const zAxisGeo = new THREE.BufferGeometry().setFromPoints(zAxisPoints);
        const zAxisLine = new THREE.Line(zAxisGeo, new THREE.LineBasicMaterial({ color: 0xb0bec5, linewidth: 1 }));
        scene.add(zAxisLine);
        // 添加微弱的辅助环境线框,不干扰主视觉
        const helperExtent = 14;
        const axisHelperMaterial = new THREE.LineBasicMaterial({ color: 0xd0d8e0, linewidth: 1 });
        // 简单在背面加两根平行线,增加空间感(可选)
        const backLine1 = [new THREE.Vector3(-1, 0, -1.5), new THREE.Vector3(xAxisEnd, 0, -1.5)];
        const backLineGeo1 = new THREE.BufferGeometry().setFromPoints(backLine1);
        const backLineObj1 = new THREE.Line(backLineGeo1, axisHelperMaterial);
        scene.add(backLineObj1);
        // ---------- 9. 响应式窗口----------
        window.addEventListener('resize', onWindowResize, false);
        function onWindowResize() {
            camera.aspect = window.innerWidth / window.innerHeight;
            camera.updateProjectionMatrix();
            renderer.setSize(window.innerWidth, window.innerHeight);
            labelRenderer.setSize(window.innerWidth, window.innerHeight);
        }
        // ---------- 10. 动画循环----------
        function animate() {
            requestAnimationFrame(animate);
            controls.update(); // 启用阻尼后需要每帧更新
            renderer.render(scene, camera);
            labelRenderer.render(scene, camera);
        }
        animate();
        // 控制台提示
        console.log('ECharts 风格柱状图已加载,坐标轴标签、柱顶数值完整展示');
    </script>
</body>

</html>
完整源码:GitHub
小结
- 本文提供 柱状图 完整 Three.js 源码与在线 Demo,建议先运行案例再改 uniform/参数做二次实验
- 更多 Three.js 实战案例见 three-cesium-examples 合集 与 GitHub 开源仓库